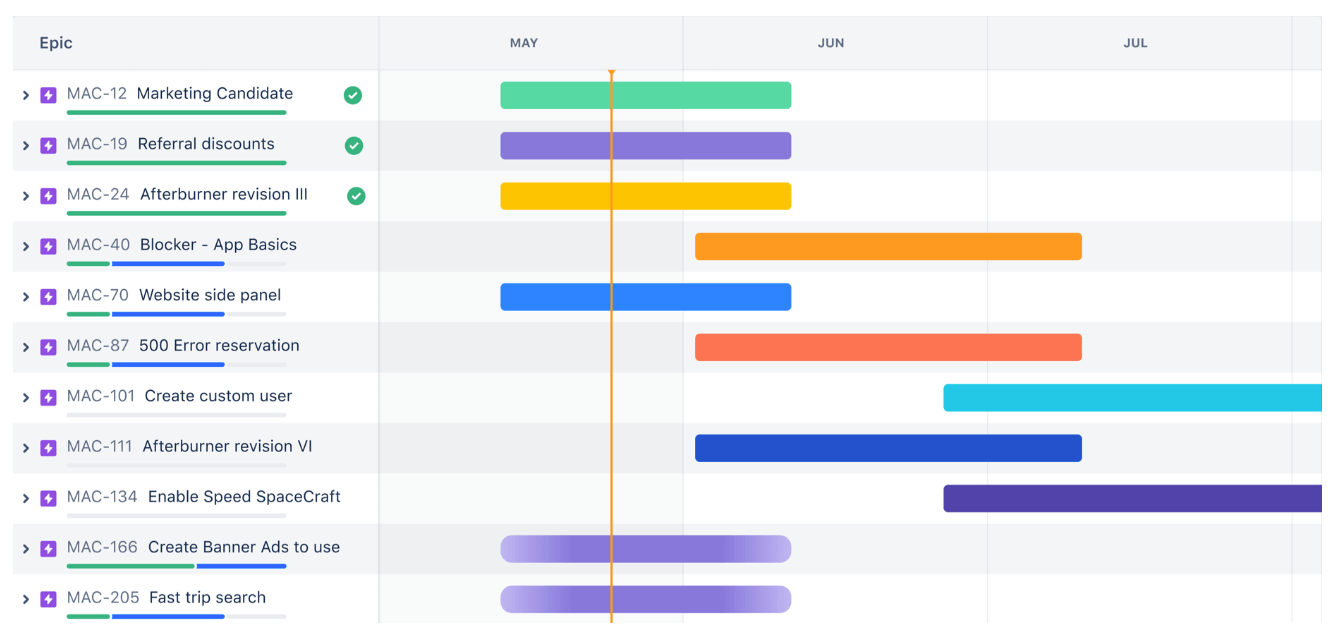
Source: Atlassian
Each bar on a Gantt chart represents a task, and its length reflects the amount of time needed to complete a step or task. When zoomed out, a Gantt chart provides project managers and other team members with a high-level overview of the work that needs to be done, the distribution of responsibilities, and the time for their execution.
A Gantt chart typically includes the following elements:
- Date and duration of each task
- Tasks
- Task owner
- Milestones
A Gantt chart can be used for many different projects and programs. Therefore, it is good to know its most popular applications:
- Creating and managing complex projects: the more complex the project, the more tasks it contains. A Gantt chart helps project managers easily visualize the project and break it down into smaller tasks.
- Monitoring task dependencies: delays can always happen. A Gantt chart helps project managers automate dependencies between tasks, so that the next stage or task cannot start before the previous one is completed.
- Tracking project progress: a Gantt chart allows you to monitor progress and milestones, so that you can easily change the project plan if necessary.
Most Gantt charts also show additional information regarding how tasks are connected to each other and who they are assigned to, and also remind you of upcoming deadlines and milestones. With a dynamic Gantt chart, team members can quickly see what tasks they have to do and how their actions contribute to the implementation of a given project.
Popular Gantt chart creation tools: Smartsheet, Team Gantt, Monday + Asana, Jira.
How to create a “Gantt”?
Define the timeframe
Your Gantt chart should be a project with a start and end date. Think of it as a timeline, your timeline must have a starting point and an ending point.
Add tasks with start and end dates
Within the overall project timeline, Gantt charts work best when individual tasks have specific start and end dates, allowing them to be visualized as bars on the chart. Missing start dates will cause them to be displayed as moments in time, which will make it difficult to visualize them.
Determine dependencies
In large projects, there will certainly be tasks that cannot be started before others are completed. To ensure smooth project execution and keep teams informed up to date, you can visualize all dependencies between tasks using a Gantt chart.
Set milestones
Unlike most tasks on a Gantt chart, milestones are specific points in time. You can think of them as checkpoints, representing the completion of larger groups of tasks. They serve to make it easier for your team to prioritize tasks, and once achieved, can also provide a great opportunity to celebrate your accomplishments.